Introduction. 1
Digital Dashboards. 1
Overview of the Process. 4
Choosing the Pilot Group. 4
Sponsor 5
Stakeholders. 5
Conducting the Needs Assessment 6
Setting the Business Goals. 6
Knowledge Worker Needs. 6
Understanding the Business Process. 7
Usage Characteristics. 7
Tapping Information Resources. 8
Types of Information Resources. 9
Improving Information Resources. 10
The Prototype. 12
Developing and Implementing the System.. 12
Conclusion. 14

Digital Dashboard
Business Process Assessment Guide
White Paper
Published: May 2000
For the latest information, please
see http://www.microsoft.com/solutions/km/default.htm
In today’s
information age, when intellectual capital and human resources are the most
critical assets of many organizations, leading companies are developing
practices and strategies for managing knowledge and information. Executives and
management teams are discovering that companies that reward collaboration and
information sharing are outperforming companies that discourage these practices
because of their corporate culture or the technologies they use.
Knowledge workers are faced with
escalating amounts of information and increasing demands for their expertise.
Consequently, they are looking constantly for the information they need to
assess the changes that are shaping the marketplace.
For years, IT professionals have promised
executives access to a wealth of information from many sources, but they have
delivered more data than workers can assimilate. Workers may be getting plenty
of information, but they need better tools to filter the information and
customize it to meet their needs.
Without properly managing its knowledge
assets, a company cannot operate profitably or grow effectively. Information is
lost, trends go unnoticed, and completed jobs are re-created.
Knowledge-management processes and technologies help organizations respond to
constantly shifting business dynamics by ensuring that workers have the information
they need to assess and act upon business opportunities.
A digital
dashboard is a customized solution for knowledge workers that consolidates
personal, team, corporate, and external information and provides single-click
access to analytical and collaborative tools. It brings an integrated view of a
company's knowledge sources to an individual's desktop, enabling better
decision making by providing immediate access to key business information.
A digital
dashboard consists of Web Parts, reusable components that can contain any kind
of Web-based information. A Web Part can be a simple component that displays a
user’s favorite Web site, or it can be a sophisticated component that
integrates your existing systems with the analytical and collaborative tools in
products such as Microsoft Office, Microsoft Exchange Server, and Microsoft SQL
Server. By creating customized Web Parts, you can
tailor a digital dashboard solution to meet the specific needs of your company.
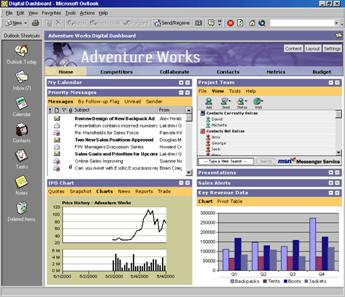
The following illustration shows a
digital dashboard for a company called Adventure Works. This digital dashboard
contains components that display the user’s Inbox, MSN Messenger Service,
calendar, and critical information about the company.
A successful digital dashboard deployment
is designed with the following goals in mind:
·
Focus on critical information. With so much information coming from
so many sources, knowledge workers often spend hours sorting through various
materials to find one key point. A digital dashboard helps solve information
overload by delivering focused, vital business data through the use of filters,
user-specified categories, and summaries. Users can access high-level
information in relevant business reports directly from digital dashboards.
·
Integrate information from a variety of
sources. Unlike some
browser-only portal solutions that deliver information solely from the Web or
an intranet, a digital dashboard integrates information from a variety of sources.
Key business data from corporate applications, Internet and intranet sites,
team folders, and personal files can all be organized and viewed easily on a
digital dashboard.
·
Use company knowledge fully. Digital dashboards enable knowledge workers to make use of each
other’s knowledge. As corporations become more global, it becomes more
difficult for workers to collaborate. Whether they are in the office next door
or on another continent, workers can use a digital dashboard to locate and
communicate with experts, collaborate on projects, and research corporate
presentations and documents. Because digital dashboards
are based on Active Server Pages and XML technology, companies can incorporate
real-time tools into their digital dashboard solutions, such as Microsoft
NetMeeting® conferencing software and Microsoft
Windows Media™ Player, which enables people to access dynamic streaming media
content such as company communications, online training materials, and business
broadcasts from the Internet or intranet.
·
Work with the same information, in the office
or on the move. Digital dashboards enable workers
to make efficient and effective business decisions no matter where they are.
Nearly 44 million people traveled for business in 1998, up 14 percent from
1994, and the average business trip lasted about 2.5 days. Knowledge workers are
often away from their desks but still to access their company’s networks and
the World Wide Web and communicate with their teams and their customers. Using
a digital dashboard, knowledge workers can view information from any
source—including messaging and company applications, public folders, and favorite
Web sites—from a Web browser, through a synchronized Outlook 2000 view, or with
a Personal Digital Assistant with wired or wireless access.
A Powerful Tool for Change
As workers increasingly use digital
dashboards to view their daily activities, share information with coworkers,
and get feedback on company performance, these systems have a profound effect
on workers’ priorities. For example, if a digital dashboard provides regular
notifications of customer-satisfaction ratings, workers become more sensitive
to the needs of their customers. In this way, you can use digital dashboards to
direct corporate focus.
Digital
dashboards can host virtually any type of information. Because of this, much of
the time designing digital dashboards is spent analyzing the needs of users,
assessing the information resources within the company, and ensuring the
cultural acceptance of the tool. The Digital Dashboard Resource Kit 2.0
includes sample dashboard, templates, and a gallery of Microsoft and
third-party Web Parts. Because of this, developing a digital dashboard is often
the simplest part of the process.
The digital dashboard development process
consists of four key steps:
·
Choosing the pilot group
·
Conducting the needs assessment
·
Tapping the information resources
·
Developing and implementing the system
The purpose of this paper is not to
outline a development methodology, but to highlight areas in which the process
of developing digital dashboards might differ from the process of developing
other types of solutions. Issues that arise when companies are developing
digital dashboards often have less to do with the application itself than with
cultural issues, information availability and consistency, and business value.
Choosing the right pilot group sets the
tone for the entire project. The culture of the company or organization usually
determines the best group of users. Consider speed, momentum, and strategic
relevance when choosing the pilot group. Choosing a strategic group within the
organization can ensure that the project’s success is both visible and
measurable.
Here are some general pointers on how to
identify potential pilot groups for digital dashboard deployments:
·
Select a visible group. A pilot group with high
visibility can generate a greater cultural shift. While a digital dashboard is
not exclusively an executive tool, the influence of executives makes them good
pilot candidates. However, because executives also have different needs than
other employees within the company, it is important to investigate the needs of
other groups through a tandem pilot.
·
Choose a group that is representative of the
strategic direction of the company. Digital dashboards often influence the way
information is delivered throughout an organization. Working with the
information and user communities that have the greatest potential value
guarantee the greatest impact.
·
Look for groups in which valuable knowledge is
being lost. For instance, a sales group that does not properly capture
information on customer visits and winning sales strategies can serve as a
pilot that has a measurable impact on revenue.
·
Consider the types of information the group
uses. If the information is stale, erroneous, or held in antiquated systems, it
can slow down a pilot project significantly.
·
Use multiple pilot sites in larger, more global
organizations. Bandwidth, cultural issues, and information needs in larger
organizations vary greatly from country to country. Not understanding these
issues may hurt the long-term effectiveness of the project.
·
Beware of groups with high barriers to
information sharing. Determine, through background interviews, the levels of
software experience and skill, receptivity towards new technology, and any
reluctance that may exist among key stakeholders. In many cases, the owners
of information or knowledge are hesitant to share. However, once people realize
the benefits of the pilot, they become more amenable to sharing information.
Find a high-level sponsor—often the CEO,
president, or business unit leader—who can help gather the necessary resources
for the project. These individuals should also receive digital dashboards. A
sponsor who endorses and uses a digital dashboard helps foster a collaborative,
team-based approach to sharing information and knowledge and can remove many
perceived risks of using the system.
In addition to the pilot group of users,
a working team of stakeholders is critical to a successful digital dashboard
deployment. Select between five and ten stakeholders; include the sponsor plus
subject matter experts, usage characteristic experts, data and information
producers, and IT professionals. Too many stakeholders can make it difficult to
balance the many needs of a large constituency.
The stakeholder team includes these
informal roles:
·
Sponsor. Provides
the motivation for change in addition to demonstrating the value of the system.
·
Business Owner.
Defines the strategic goals of the pilot project and ensures focus on enhancing
business productivity.
·
Technology Infrastructure Owner. Gives perspective on the maintenance of the system and the
long-term impact of digital dashboards on the organization.
·
Pilot Group Representative. Brings the knowledge workers’ perspective to the stakeholder team.
This person should focus on the difficulties of adapting end users to the
system rather than on the final benefits.
·
Information-Resource Owners. Represents the people who manage information resources that will be
available on the digital dashboard. Typical resources, which are discussed
later in this paper, are customer-relationship information, accounting data,
and training and development content.
In smaller businesses, the more organic
nature of the organization and the less complex infrastructure often means that
these types of broad stakeholder teams can be managed in a more ad-hoc fashion.
A digital
dashboard is an excellent way to combine information from disparate sources
into an integrated, customizable, and interactive environment. A needs-assessment clarifies which information sources will yield
the greatest impact as a part of a digital dashboard solution. To assure a
rapid development process, you can conduct the needs-assessment at the same
time you identify available sources of information.
The needs-assessment balances end-user
needs with the overall business strategy. Digital dashboard projects tend to
start with a limited focus and then grow. Too often, as additional stakeholders
provide requirements and specifications, the project becomes increasingly
complex and cultural issues begin to pile up. This added complexity often makes
it difficult or impossible to deliver an end-to-end system in a reasonable
time. In addition, these projects often involve multiple iterations, so it is
important to focus on the components that add the most value.
Because digital dashboards are inherently
flexible, the temptation to solve every problem and present every type of
information in a digital dashboard can lead to feature creep, which
results in a lack of focus. To help guide the needs assessment process, decide
which business objectives the digital dashboard will support and use these
objectives to prioritize the components that you include on your digital
dashboards.
If you design your digital dashboards to
meet clearly defined business goals, they can reinforce your company’s business
priorities. For example, if you create digital dashboards to highlight customer
satisfaction in a particular market segment or an organizational value such as
training, users will have these company initiatives in the forefront of their
minds.
Because digital
dashboards are a new type of solution, the greatest challenge may be in
educating the sponsor, stakeholders, and pilot group about the opportunities
that digital dashboards offer. At the beginning of the needs assessment,
demonstrate the functionality that digital dashboards can provide. To do this,
you can use the Digital Dashboard Resource Kit 2.0, which provides everything
you need to create digital dashboards and Web Parts. The resource kit includes
sample dashboards and templates that you can easily customize to meet the needs
of your organization. In addition, the resource kit contains a gallery of
Microsoft and third-party Web Parts, allowing you to create demonstration
dashboards for your users quickly and easily.
Use examples that are specific to your
company to engage participants and provokes further investigation into the solution.
Here are some examples of the functionality you may want to include in your
first Web Parts:
·
Automated alerts based on strategic goals
·
Relevant industry news
·
Financial reporting with in-depth analysis
·
Project tracking and reminders
·
A specific line-of-business application such as
sales-force automation
·
Customer information—both external and internal
·
Business analysis
·
Personal calendar, electronic mail, and tasks
·
Weather, traffic, and other external news that
may affect business
While it may seem tangential, life-style
information can encourage people to use a digital dashboard on a consistent
basis. Often, information such as weather, sports, and traffic can keep a
digital dashboard attractive and interesting to users. Keep in mind, though,
that too many channels of information can slow network bandwidth and too much
life-style information can detract from your original business goals.
Consider the types of information the
pilot group uses frequently to help prioritize content on the digital
dashboard. Ask the pilot group to define the information they need to make
decisions. Boiling it down to this level forces people to consider which
information is absolutely necessary.
The following characteristics are
hallmarks of information that are useful in a digital dashboard:
·
Information that is used consistently
·
Information that has strategic relevance
·
Alerts where timeliness is key
·
Paperless storage areas that are accessed
frequently, such as a forms library
Once you have identified what kinds of information should be
included in your digital dashboard, focus on how that information is used. If
you don’t provide information in a usable format, people will use the digital
dashboard inconsistently or not at all.
Consider the following issues to determine how the various sources
and types of information are used:
·
Does the information need to be available
offline? This depends on roles of users in your
organization. Make sure that the pilot group reflects the needs of the
corporation as a whole. If you run the digital dashboard in the Microsoft
Outlook® messaging and collaboration client, virtually any information,
whether it’s data from Exchange Server, SQL Server, or the Web, can be taken
offline.
·
Is the information read-only? While digital dashboards dynamically enable knowledge workers to
find information easily, you may want to limit your users’ ability to write to
certain information sources. If the underlying applications are based on the
Windows DNA platform and support the Microsoft Windows security model, access
rights are not an issue. Environments with multiple security systems can be
difficult for users, requiring them to log into multiple applications.
·
Can the user change data when offline? If users will enter data while offline, you need a way to store that
data until it is synchronized to the server. Outlook, Exchange Server, and SQL
Server support this type of data entry and can be synchronized with other
databases to ensure data integrity between information stores.
·
How current must the data be? Sometimes having up-to-the-minute data is not as important as
making data available offline. While Microsoft products support
up-to-the-second information gathering and distribution, consider the tradeoffs,
such as network bandwidth, the security of financial-information, and client
storage capacities.
·
Can information be customized and to what
degree? The types of information
you include—such as personal or business information—may dictate the extent to
which you and your users can tailor it. Personal information, such as e-mail
and day-to-day project files, generally requires a high level of customization
based on personal preferences, while business information can generally be
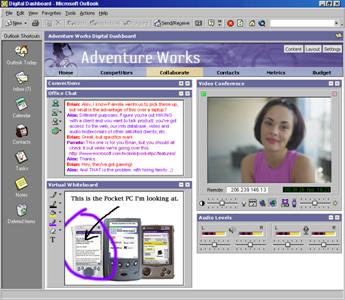
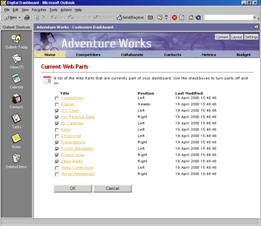
tailored to the user’s role in the organization. This information will help you
plan the Web Parts you want to include in your dashboard. User can choose from
a variety of Web Parts and then position them on a digital dashboard according
to their personal work style and needs, as shown in the following
illustrations.

In most cases, much of the information a
digital dashboard requires already exists within a company. Work with
stakeholders and information-resource owners to identify which information
assets to tap for a digital dashboard. Often these resources are located on a
mainframe or in a data warehouse. In other cases, the information may be in a semi-structured
format or on the Web.
Collaborate with information-resource
owners to get buy-in and assistance with operational, host integration, and
support issues. While the digital dashboard concept is designed to follow a self-service
model, information-resource owners often play a key role in planning ongoing
support and administration of a digital dashboard infrastructure.
Information-resource owners are often helpful in determining and discovering
where the best data and information sources are located and in what format.
A digital dashboard is not just one
system or one application. It is an integrated view of data from a variety of
sources and even multiple applications. When evaluating what types of
information to include on a digital dashboard, make sure to get a mix of all
the items that workers use during the day.
Knowledge workers tend to keep large
amounts of information on their hard drives. The most common items are e-mail
and calendar items, items that never appear on traditional server portals. By
adding Web Parts that display a user’s Internet Explorer home page or Outlook
Today, it is easy to include personal information on a digital dashboard.
Team Information
Resources and Tools
In today’s global environment, teams
often work across organizational and geographic boundaries. Exchange Server
helps capture what these teams learn and facilitates collaboration among
dispersed teams. Because digital dashboards can incorporate information that is
available in Outlook 2000, knowledge workers have access to the tools they need
to share documents, discussions, tasks, and more.
Ways in which team members exchange
information can vary from ad-hoc sharing of documents and discussions to the
use of structured, process-based applications. You can include all of these
elements in a digital dashboard.
In addition to capturing shared
information, you can incorporate tools into your digital dashboards such as
Exchange Conferencing Services, Chat Services, and Microsoft NetMeeting®
conferencing software, which allows people to share applications and
collaborate face-to-face over an intranet or the Internet.
Corporate Information Resources
Corporate information systems store much
of the crucial information that can be included in a digital dashboard. These
information systems are distinct from other resources because they are usually
controlled by the IT group and have a highly organized system of maintenance
and security. The presence of legacy data and the massive requirements placed
on these systems makes corporate information resources difficult to deal with.
However, the payoff for working with this information is a greater
understanding of your business, markets, and customers.
Knowledge workers are often inundated
with paper-based weekly, monthly, and quarterly reports, which are often from
mainframe- or ERP-based systems. Not only are these paper-based reports
expensive, but there is no intelligent way to filter the information based on
business rules to alert people to problems or opportunities. If you move the
data from these systems into applications such as Office 2000, you can provide
interactive reporting by including the data in Web Parts on a digital
dashboard.
External Information Resources
Knowledge workers must stay abreast of
world events, publications, legislative affairs, and competitors. Information
resources can be a dynamic repository of hyperlinks, a news and stock ticker
scrolling across the screen, a targeted news wire that covers a specific
industry, or a bulletin board or issue forum.
Digital dashboards are based on Web
standards, such as XML, DHTML, and Active Server Pages, so integrating external
content is easy. Because of the broad availability and variety of external information,
you may want to include a Web Part that displays a customization engine, such
as the MSN home page.
Significant issues can arise when you are
working with corporate information resources, which are often complex and
housed in legacy systems.
Information Islands
One of the most common problems is
information stored in multiple systems across a corporation. Depending on the
type of information, you can use a number of tools to consolidate information
across a range of systems. For example:
·
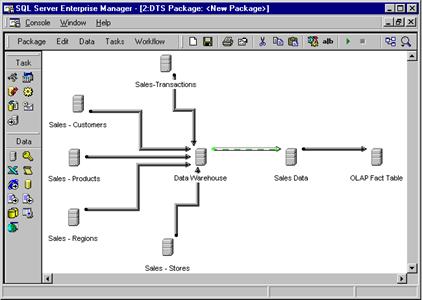
Accounting, customer, and other
line-of-business data. This type of data is often
stored in a variety of systems. SQL Server 7.0 includes a feature called Data
Transformation Services (DTS), which consolidates data from many modern and
legacy databases, enabling better reporting and easier understanding of the
business as a whole. This service can also reduce the expensive and
time-consuming process of manually “rolling-up” financial reporting. For more
information on DTS see the SQL Server 7.0
Data Warehousing Framework white paper. The following illustration shows
the DTS Package Designer.
·
Documents, discussions, and Web pages. This type of information is generally more dispersed than corporate
data because it is generated in a more ad-hoc fashion. Microsoft Site Server
3.0 includes a sophisticated search mechanism that can search across documents,
discussions, internal and external Web sites, and SQL Server databases. With
this capability, knowledge workers can confidently search across the entire
corporate memory. Once this type of cross-company catalog is established, it is
easy to integrate it into a digital dashboard. For detailed information about
the search functionality of Site Server, please see the white paper Implementing
Search in the Enterprise.
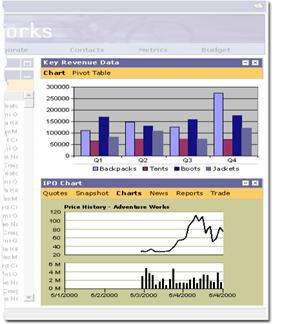
Poor Reporting
As mentioned earlier, paper-based
reporting is inadequate for detecting trends. The combination of Office 2000
and SQL Server allows knowledge workers to connect directly to business data
and use Online Analytical Processing (OLAP) technology to perform sophisticated
and flexible analyses through Microsoft Excel. For more information on MSOLAP,
please see the white paper SQL Server 7.0
OLAP Services. The following illustration shows how data from a SQL Server
data warehouse can be integrated into a digital dashboard view.
Heterogeneous Collaborative Infrastructure
When knowledge workers need to
communicate with subject matter experts or their teammates, a fractured
collaboration and messaging system can get in the way.
E-mail messages, discussions, and shared
document folders are an efficient way to communicate in today’s mobile and
global environment. Microsoft Exchange Server provides a platform that can
scale to support any organization’s messaging and collaboration needs in a
consistent seamless fashion.
In addition, teams can use tools such as
the Microsoft Team Folders Wizard to build and deploy team-based applications
that are built on the same central Exchange-based e-mail infrastructure. This
guarantees that knowledge workers get the resources they need to get their jobs
done efficiently.
You can incorporate all of these features
in the Web Parts that you include on your digital dashboards.
Lack of a Common Taxonomy
The most significant roadblock to effectively integrating
information resources for digital dashboards is the lack of a common way of
labeling or tagging information. Often, one business unit may call a metric by
a name that differs substantially from the one that another department uses. A
similar problem occurs when two departments refer to a metric by the same name,
but are actually referring to two different metrics.
This is usually a cultural problem, but
you can resolve it by working toward a common taxonomy.
The Prototype
Begin prototyping early with information
resources. The development cost is fairly minimal, and a prototype can help
expose holes and inconsistencies in the information, which you can fix while
you’re constructing your digital dashboard solution. When presenting the
prototype and findings to the stakeholder team, show the team members several
options for business metrics and application targets. A group setting helps
solidify the team agenda rather than allowing individuals to break off from the
group focus.
This paper is not intended to provide a
development methodology or outline a development approach for digital
dashboards. Microsoft provides the Microsoft Solutions Framework as support
for industry partners and customers who are looking to better understand these
processes. Outlined here are some of the critical issues you should consider
when developing digital dashboards.
Development Teams
There are two key roles in implementing
digital dashboards. Depending on the amount of work required to identify the information
resources, responsibilities can be shared across the roles. The first role
focuses on finding, normalizing, and preparing information resources to be
included in a digital dashboard. The second role focuses on developing and
refining the four to five Web Parts that are digital dashboard components.
Because the sample digital dashboards in the Digital Dashboard Resource Kit
2.0, provide a ready-made user interface and predefined styles that you can use
to customize the look and feel of your digital dashboards, you can focus on
delivering the correct content instead of constructing the user interface.
Development takes place through a series
of steps. As you show prototypes and betas to users and stakeholders, you will
define additional requirements, refine taxonomies, and reach a general
consensus on your business priorities. Early in the process, pay close
attention to the presentation of the information; later revisions will
emphasize data issues.
A demonstration helps prepare your users
for a digital dashboard deployment. It can facilitate the necessary cultural
transformation and pave the way for the implementation of the technology. This
is the first opportunity for stakeholders to compare their vision of the system
to the needs of the end users. If end users agree with the vision, adopting the
system becomes much easier. This process should include:
·
An outline of the goals and long-term vision for
the digital dashboard or dashboards.
·
Support from the sponsor of the program,
demonstrating his or her personal digital dashboard. In addition, the sponsor
should make a statement underlining the importance of knowledge sharing to the
company.
·
A demonstration of a digital dashboard beta
itself.
Do not expect that your first digital
dashboard to solve your organization’s problems. Instead, focus on how a
digital dashboard can assist knowledge workers in solving certain types of
information delivery and collaboration problems. The goal is to stimulate
thought about how the system might solve a variety of problems.
Throughout the design review process,
continue to incorporate feedback from various groups, meet with stakeholders to
review applications, explore reactions to the initial demonstration, and refine
the Web Parts you’ve created for the digital dashboard. Be sure to conduct the
design reviews in as way that keeps the stakeholders in agreement of design
goals and business metrics.
Testing a digital dashboard solution is a
little different than testing other applications. The most likely source of
errors (and the most troublesome to detect and correct) is the quality and
timeliness of information the digital dashboard displays. Therefore, it is
critical to include subject matter experts as testers. Testers who are
not subject matter experts usually cannot determine the difference between good
information and bad information.
Digital dashboard applications have an
enhanced user interface that combines familiar Office features with easy-to-use
Web-browser-style controls. Users can click links to pages that allow them to
customize the look and feel of their digital dashboards or add new Web Parts.
Because digital dashboard applications incorporate so many familiar features,
users do not need training to learn how to use them; for example, users can
position Web Parts on a dashboard using a drag-and-drop operation.
System documentation is key to any
development project, especially documenting how data and information are linked
together. These data flow processes and their underlying data models must be
thoroughly documented, including the timing of the information as it moves from
data store to data store.
Ongoing Feedback
Include a feedback loop after you deploy
your digital dashboard. This can consist simply of a public folder for
discussions that is monitored by a team of information-resource owners, support
people, the sponsor, and the development team. This serves not only as a
support mechanism, but also as a learning device because it captures
information about the benefits and disadvantages of your digital dashboard that
you can use in later versions.
Digital dashboards are business solutions
that help knowledge workers work together intelligently. The process of
creating a digital dashboard can itself be a learning experience for an
organization. By focusing information technology more precisely on the key
strategic imperatives of a corporation, these tools allow information
technology professionals to deliver more value to the organization.
For more information: See the Microsoft
Digital Dashboard Home Page.
uuuu
Spectria is a Microsoft solution provider
specializing in the design, development & deployment of digital dashboards.
“We build secure e-business solutions for the wired and wireless world” –
allowing us to integrate digital dashboards into even
the most complex corporate and e-business environments. For more information about partnering with Spectria, please contact
Larry Cooper at (888) 516-9600 or visit www.spectria.com.
The information
contained in this document represents the current view of Microsoft Corporation
on the issues discussed as of the date of publication. Because Microsoft must
respond to changing market conditions, it should not be interpreted to be a
commitment on the part of Microsoft, and Microsoft cannot guarantee the
accuracy of any information presented after the date of publication.
This document is
for informational purposes only. MICROSOFT MAKES NO WARRANTIES, EXPRESS OR
IMPLIED, IN THIS DOCUMENT.
© 2000 Microsoft
Corporation. All rights reserved.
Microsoft, MSN, NetMeeting, NetShow,
Outlook, Windows Media, and Windows NT are either registered trademarks or
trademarks of Microsoft Corporation in the U.S.A. and/or other countries.
Other company and
product names mentioned herein may be the trademarks of their respective
owners.
The names of companies, products, people,
characters, and/or data mentioned herein are fictitious and are in no way
intended to represent any real individual, company, product, or event, unless
otherwise noted.